
I have said many times before that tyres are one of my biggest headaches, it seems a never ending problem for us. I read recently that a tyre fitting company – can’t say who they are, but apparently they have some quick fitters – says recent data has shown that pothole damage to vehicles is on the increase again. But it’s not only tyres that are costing money, but also mechanical parts too, such as suspension and wheels. Many cars needed wheel realignment and the advanced driver assistance systems [ADAS] also needed attention.
I know from our own experience that potholes are burning a big hole in our service and repair budget. But it’s not just the cost of repairs and replacement, it’s the inconvenience and time lost by our drivers. I would think the vast majority, if not all of our vehicles don’t have a spare wheel – they rely on the temporary fix kit, that often doesn’t work, or faces a hole too big to repair. Then they try to get someone out, or get it to a tyre fitter, and hope they can either repair it, or can quickly get a new tyre. And all of this is wasting the driver’s valuable time.
I have also carried out some intensive research on this subject, I called to see our small, local tyre shop, and asked him if the problem was growing, he too confirmed that business was great, and getting better, due in part to potholes. I’m so glad somebody is happy about it.
Monitoring CO2
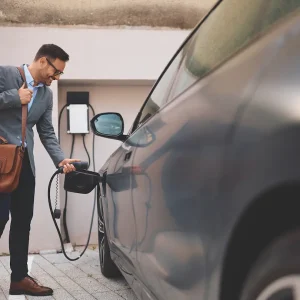
As the weather is improving, it is noticeable that many of our office staff are now going outside for their morning and afternoon tea and coffee breaks. And pleased to see our electric vehicle charger is being used – it is the perfect shape and size to put a few mugs on, they all love it. But would love it even more if we could connect one of those heaters to it, like they have in pub gardens.
Our EV charger is operated via an app – you start the charge and finish it, or put on a timer all using a mobile phone or a PC in the office. But recently I found on the App something called the “Grid CO2 Insights’ that tells you what the day’s forecast will be for CO2 emissions in your area. It does advise to charge during lower CO2 periods to reduce your footprint.
On a ‘moderate’ day it shows 132g CO2/kWh, a ‘low’ day under 100g, a ‘high’ day 219g, and a ‘very high’ day 318g. But these figures do vary wildly between different areas.
There will be areas where a lot of wind and solar is used, and there will be EV owners who produce their own means to get green electricity, so it’s not the same for everyone.
Now, I’m not bright enough to work out what all this means. I’ve tried looking it up, and trying to understand it, but to no avail. But the point is, do these figures mean there is more CO2 being produced to make the electricity, a lot less, or similar? I, unfortunately don’t have the answer, but it’s a really good idea to be able to see at a glance when it is a good, and bad time to charge a vehicle.
Supported by: